List of Known Issues in KPIs
| Issue | |
|---|---|
All Calculations are treated as numbers. stage 1 - A. change the user calc and standard calc so it has 3 new fields DisplayType is [ P=Percent | N=Number | C=Currency ], DisplayPrecision [ 0,1,2,3 ] D.P. and CalcRule do we [ sum | average | balance ] B. Using (A) change the calculation of summary YTD and All Year figures stage 2 - in the View KPI > YTD Summary screen show data as per display rules and in charts show data appropriately Background. All calculations are display as numbers. The assumption that the calculated monthly figures can be added to give a YTD figure. If the calculation is a percent then this gives the wrong YTD. Also although it is possible to calculate ratio these will be display as decimal fraction ie. 50% as 0.5 – The ability to nominate a Display Type and Format in Standard Calc and User Calc’s eg. Is it a [ Percentage | Number | Currency ], along with display precision ( number of decimal points 0,1, 2) , do we [ sum | average | balance ] Workaround: take out of KPI report and format it in Excel. | |
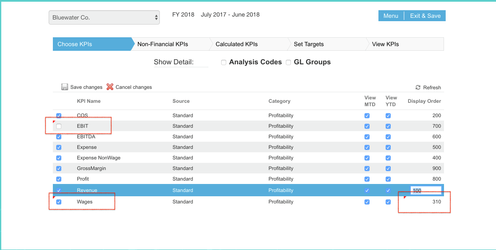
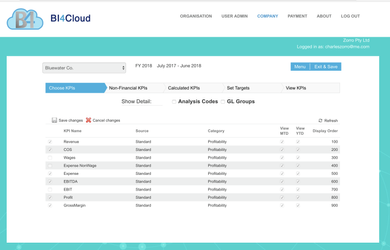
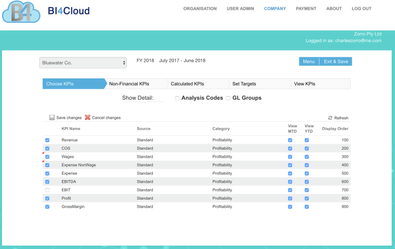
3. [Blocker] When changes are made in the Choose KPIs the red triangle indicates change (selected and display order) . When the Save Changes is pressed it the screen reverts back to the previous value. The data IS written to the MSSQL database but the refresh logic is looking at the Columnar DB. It may be best to update the values from this table to the MS-SQL DB and then read and write from MS-SQL DB. Workaround – do edits, press Save Changes, select View KPIs tab, press Refresh and go back to Choose KPIs and you see the changes.
| BIC-92 - Getting issue details... STATUS 4. |
4. [Blocker] When new Non-Financial KPI or Calculated KPI are entered they do not display in the “Choose KPI” panel. This is because date for “Choose KPI” panel is sourced from the Columnar DB and not the MS SQL DB. Workaround – Choose View KPI’s and press Refresh button | BIC-93 - Getting issue details... STATUS |
| 5. [Major] Standard formulas are calculated using Report Codes. The Accounts are encoded into these Report Codes by the Extract (ETL) process. Sometimes the attributes of the Accounts are not precise enough to determine the Report Code they belong to. Eg. MYOB has no indicator for Depreciation Expense. The ETL looks for Account whose type is “Expense” and that contain “Depreciation” in the account name. if it can’t find that it will not code it to Report Code. Other wobbly parsed values are Examples “EXP-DA” – Expense Depreciation and Amortisation. Other wobbly parsed vallaues are “EXP-OTH-INT” – Interest expense Workaround, “EXP-OTH-TAX” – Tax Expense ‘INV-OTH-INT” – Interest Income Work around: define these accounts in GL CustomLists | BIC-94 - Getting issue details... STATUS |
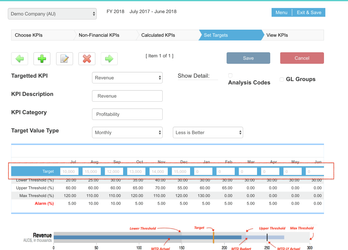
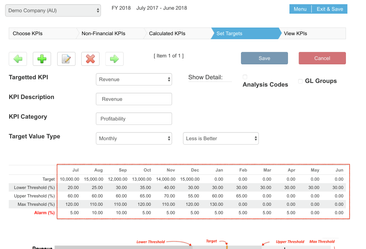
In Set Target A User can click into lower scrolling area and they will think they can enter data but its blocked because they need to select “EDIT” first. Is there a simple way to stop the “screen change –ie the “blue surround” or to dialogue – “You need to press Edit to change data” when the user clicks the monthly value because they will be confused and think it’s a bug and raise a ticket.
| BIC-98 - Getting issue details... STATUS |
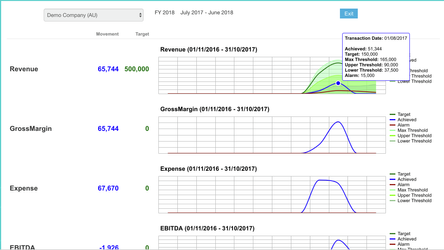
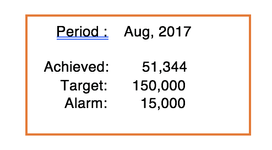
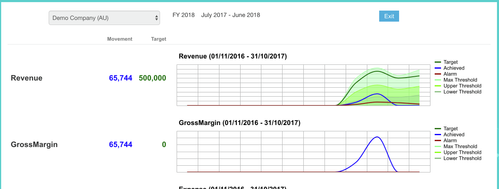
9. [Normal] When charts are displayed the popup legend is very busy. Suggest transaction date be displayed as “MMM,YYYY“. Also display words: Period (change Transaction Date), Achieved, Target and Alarm be right Aligned to the width of the widest text and that the numbers be right justified ( see Example Box). Also the “Threshold” text and values be removed from the POPUP. In the side bar rename “Lower Threshold” to “Low Zone”, “Upper Threshold” to “Mid Zone” and “Max Threshold” to “High Zone”
| BIC-99 - Getting issue details... STATUS |
. | BIC-90 - Getting issue details... STATUS |
2. [Minor] With the KPI screen open and no activity the browser times out. When one returns to it the red triangles indicate changes but save does not work. It would be nice to have a pop-up saying times-out. Workaround – refresh browser and login in again.
| BIC-91 - Getting issue details... STATUS |
7. [Minor] Decimal place precision takes up screen space and is unnecessary – ( KPI Targets )
| BIC-97 - Getting issue details... STATUS |
Heading says "Visualise KPI" should say "KPIs" Tolerate | BIC-85 - Getting issue details... STATUS |
Press KPI Button Displays "No records" Choose Cool Stuff > KPI and setup some KPIs before using pressing the KPI button | BIC-86 - Getting issue details... STATUS |
| When no KPI set shows "No Records" | BIC-87 - Getting issue details... STATUS |